The CDC released new data in June 2026 that shows the US mesothelioma death rate was 0.5 in 100,000 in 2024 and 2,114 deaths from mesothelioma were reported. Men die at a higher rate than women, with an age-adjusted rate of 0.8 per 100,000 for men and 0.2 per 100,000 for women in 2024.
Learn more about mesothelioma, asbestos and the steps you can take to fight this disease.
Mesothelioma death rates show how many people die from this disease each year out of a certain number of people. These groups can be based on where people live, their age or other factors. The terms mesothelioma death rate and mesothelioma mortality rate mean the same thing. Both count deaths from any cause or from mesothelioma in those groups.
Several factors can change these numbers. For example, a person’s age, exposure to asbestos and type of treatment all affect death rates. Understanding these rates helps us see how serious mesothelioma is and why getting treatment early matters.
Key Mesothelioma Death Rate Statistics
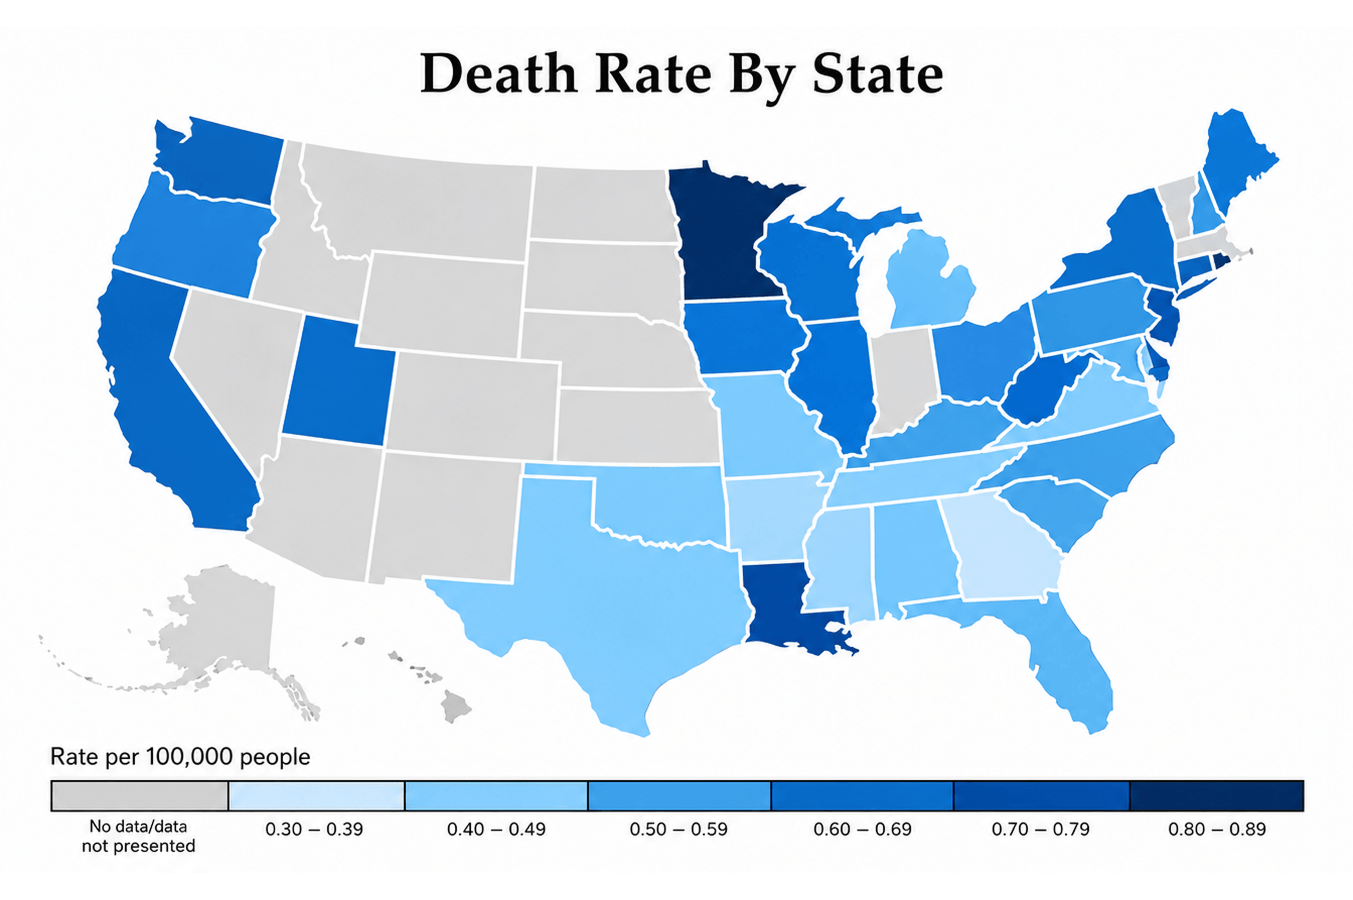
Mesothelioma death rates are highest in Oregon, Maine and Minnesota.
Adults ages 85 and older have the highest death rate of 7.2 per 100,000.
Asian and Pacific Islanders account for the lowest age-adjusted death rate of 0.2 per 100,000.
Recent world data shows mesothelioma deaths remain high, especially in places where asbestos exposure happened in the past. The World Health Organization reports more than 30,000 deaths globally each year. About 2,500 people die from this disease every year in the United States.
Older adults who were exposed to asbestos at work decades ago have higher death rates. This information helps us see how important it is to prevent exposure and get treatment early.
What Is the Mesothelioma Death Rate in the US?
The mesothelioma death rate was 0.5 of 100,000 in the U.S. in 2024, according to CDC and US Cancer Statistics newly released in June 2026. In 2024, 2,114 people died of mesothelioma in the U.S. These numbers reflect people of all genders, ages, races and ethnicities from across the country.
Asbestos exposure plays a large role in mesothelioma death rates. Mesothelioma statistics show people exposed to asbestos are more likely to develop and die from mesothelioma. States with the most industry or natural deposits have the highest asbestos exposure and the highest mesothelioma death rates.
Doctors and researchers track the mesothelioma death rate to understand how this disease affects different groups of people. Several factors can change these numbers, including a person’s age, asbestos exposure history and type of treatment, which is why getting treatment early matters.
The map shows how mesothelioma death rates are higher in the northeastern part of the United States.
Mesothelioma Deaths by State
The states with the highest death rate per 100,000 people in 2024 were Rhode Island, Louisiana, Wisconsin, Indiana and Virginia. A high death rate doesn’t always mean a high number of deaths. States with large populations often rank lower on the rate but account for more total deaths. California, Florida, Texas, New York and Pennsylvania recorded the highest total number of mesothelioma deaths in 2024.
The highest mesothelioma death rates occur in states with a heavy industrial past. Rhode Island, Louisiana, Virginia and Wisconsin all have major shipyard or manufacturing histories, and Indiana’s steel mills and automotive plants caused decades of occupational exposure. California, Florida, Texas, New York and Pennsylvania, the states with the most total deaths, share that same industrial legacy with shipyards, oil refineries, steel mills and some of the country’s largest natural asbestos deposits concentrated along their coasts and corridors.
US Mesothelioma Deaths by State
State
Rate per 100,000 (2024)
Total Deaths (2024)
Rate per 100,000 (2020–2024)
Total Deaths (2020–2024)
Highest Death Rates
Rhode Island
1.4
20
0.8
61
Louisiana
0.9
56
0.8
222
Wisconsin
0.8
59
0.7
266
Indiana
0.7
57
0.6
255
Virginia
0.7
75
0.6
336
Most Total Deaths
California
0.5
223
0.5
1,164
Florida
0.4
161
0.5
849
Texas
0.4
126
0.5
682
New York
0.4
118
0.5
589
Pennsylvania
0.6
114
0.6
590
Source: CDC and US Cancer Statistics, June 2026.
Mesothelioma Death Rates by Demographic
Mesothelioma death rates differ widely among demographic groups. Factors include age, gender, race and job history. Older people, especially those ages 75 and up, face the highest mesothelioma death rates. A 20- to 60-year gap or latency period exists between asbestos exposure and disease onset.
Men get mesothelioma more often than women because they have traditionally worked in higher-risk jobs like construction and shipbuilding. In addition to work, where a person lives and their economic situation also affect their risk. Places with past asbestos use and limited access to healthcare usually have higher death rates.
Gender
The gap in mesothelioma death rates between men and women highlights an ongoing occupational health challenge. Although safety has improved, men still face higher risks because they have historically worked in industries with high asbestos exposure. In 2024, men had an age-adjusted death rate of 0.8 per 100,000, four times higher than the women’s rate of 0.2 per 100,000.
In 2024, 1,540 men and 574 women died of mesothelioma in the U.S. Women’s exposure has come from many sources, including occupational work in industries like manufacturing and construction, secondhand exposure from family members who worked with asbestos and consumer products like baby powder and cosmetics that used talc, a mineral that can easily become contaminated with asbestos.
Mesothelioma Deaths by Sex, 2024
Sex
Age-Adjusted Rate per 100,000
Total Deaths
Male and Female
0.5
2,114
Male
0.8
1,540
Female
0.2
574
Source: CDC and US Cancer Statistics, June 2026.
Mesothelioma Death Rates by Age
Mesothelioma death rates are much higher in adults age 75 and older. CDC data indicates the risk of dying from mesothelioma increases as people age.
People aged 85 and older have the highest crude death rate at 7.2 per 100,000, while adults ages 40 to 49 have the lowest at 0.1 per 100,000. The crude death rate counts the total number of deaths in a group without adjusting for factors like age. This makes it useful for comparing death rates between different age groups because it shows the actual death risk for each group.
A recent study from South Korea found that malignant mesothelioma takes about 34 years to develop after asbestos exposure. This long gap helps explain why many people only develop mesothelioma when they are older.
Mesothelioma Death Rates by Age Group, 2024
Age Group
Rate per 100,000
Total Deaths
40–44
0.1
18
45–49
0.1
27
50–54
0.2
32
55–59
0.3
71
60–64
0.6
123
65–69
1.0
194
70–74
1.9
303
75–79
3.5
420
80–84
6.1
446
85+
7.2
466
Source: CDC and US Cancer Statistics, June 2026.
Mesothelioma death rates are highest among the 80+ age group.
Mesothelioma Death Rates by Race and Ethnicity
In 2024, white, non-Hispanic individuals had the highest age-adjusted mesothelioma death rate at 0.6 per 100,000. Data were not reported for American Indian or Alaska Native, non-Hispanic individuals or Native Hawaiian or other Pacific Islander, non-Hispanic individuals.
Studies also show Black people with mesothelioma have poorer survival rates compared to white and Asian individuals. The 1-year and 5-year survival rates from 2000 to 2019 for Black people are 29% and 1%, compared to 33.2% and 2.1% for white people.
Your overall health and comorbid health conditions can affect mortality rates with mesothelioma. Comorbidities, the simultaneous presence of two or more medical conditions in a patient, are other health conditions that occur with mesothelioma.
Other Factors That Impact Mortality
Amount of asbestos exposure
Increased awareness of exposure and mesothelioma
Innovations in treatments
Latency period of mesothelioma
Type of mesothelioma
People with mesothelioma are more likely to have high blood pressure, diabetes, coronary artery disease and COPD. The CDC states that some of the leading causes of death in the U.S. are heart disease and diabetes. After a mesothelioma diagnosis, it’s vital to treat other health issues. Take care of your overall health.
Patient Advocate Dr. Snehal Smart tells us, “This rare cancer has hard numbers that can scare people. But I tell our patients and their families that there is hope. Mesothelioma specialists can help them find it. They should also use treatments and support groups.”
Exclusive Content
Linda Hooper: Finding Out I Had Mesothelioma
When I first heard mesothelioma, I don’t think I’d ever heard it before. Or if I had, it just kind of blew over me because it didn’t mean anything. It sounds like a type of cancer. It just the word sounds like cancer.
Mesothelioma Type
Mesothelioma is divided into several types, each with a unique survival rate. Pleural mesothelioma accounts for about 80% of U.S. mesothelioma cases, while peritoneal mesothelioma makes up about 20%. Overall, mesothelioma has a poor prognosis. But individual responses to treatment varies.
The median survival rate with mesothelioma is 1 year. This means that 1 year after diagnosis, 50% of individuals with mesothelioma are still alive. The 5-year survival rate for pleural mesothelioma is 12%, whereas the 5-year survival rate for peritoneal mesothelioma is 65%.
One-year survival rates are about 73% for pleural mesothelioma patients and 92% for those with peritoneal mesothelioma. These differences help explain why peritoneal mesothelioma has a lower mortality rate and highlight the need for treatment tailored to the mesothelioma type.
Asbestos Exposure and Latency Period
Mesothelioma develops after a long latency period, typically 20-60 years following asbestos exposure. Many don’t show symptoms until decades after exposure. This latency makes early detection difficult.
The risk of dying from mesothelioma depends on the level of asbestos exposure. States with a history of heavy industry, such as shipbuilding and mining, tend to have higher rates of asbestos-related deaths. California, New York and Pennsylvania are among the states with elevated asbestos exposure risks.
Improved Mesothelioma Treatments
Doctors and researchers have made progress in developing advanced mesothelioma treatments in recent years. Chemotherapy, especially when used in combination with other drugs like immunotherapy, helps people live longer and delays tumor growth. Evidence suggests that combination chemo can extend life by about 3 months on average.
Immunotherapy helps the immune system find and destroy cancer cells. Doctors may now recommend a combination of Opdivo (nivolumab) and Yervoy (ipilimumab) as a first-line treatment. In 2024, the U.S. Food and Drug Administration approved Keytruda (pembrolizumab) with the chemo drug Alimta (pemetrexed) and platinum chemo for treating pleural mesothelioma.
Some people may benefit from newer treatments like Tumor Treating Fields. These use electrical fields to stop cancer cells from growing or dividing. The FDA has approved TTFields for treating malignant pleural mesothelioma.
Expert Insight
Mesothelioma is an aggressive cancer, and the treatments for it can be tough. But some patients can live much longer with this treatment. The treatment combines chemotherapy, radiation and surgery. The patients who derive a benefit from this type of tough treatment and who live longer are patients who have a cell type called epithelial type or biphasic type.
Dr. Jacques Fontaine, thoracic surgeon and director of the Mesothelioma Research and Treatment Center at Moffitt Cancer Center
Mesothelioma and Asbestos Awareness
More people are now aware of the risks linked to mesothelioma, especially those who were exposed to asbestos in the past. The U.S. still hasn’t fully banned asbestos, but a federal ban on chrysotile asbestos went into effect in March 2024. Experts hope this step will lower future cases and mesothelioma deaths.
Mesothelioma screenings can help doctors find the disease early, when treatment works better. Sadly, most people are diagnosed at a later stage, which limits their options. If you have a history of asbestos exposure, talk to your doctor about whether you qualify for screening.
Survivor Experience
I think that a lot of things need to be done to increase the awareness about mesothelioma and asbestos. One thing is, I believe, that it should be publicized more, just as the other cancers, such as breast cancer.
Tamron Little, peritoneal mesothelioma survivor and Survivor Advocate at The Mesothelioma Center
Verified Asbestos.com Survivor
Common Questions About Mesothelioma Death Rates
What countries have the highest mesothelioma death rates?
Australia, the UK and the US have the highest mesothelioma death rates. They used a lot of asbestos in construction, shipbuilding and manufacturing. Australia has the highest rate. This is due to heavy asbestos use in 20th-century mining and construction. Though bans on asbestos have reduced exposure, deaths still occur. The disease has a long latency period.
Are there genetic factors that influence mesothelioma mortality?
Yes, genetics can play a role in mesothelioma susceptibility. Some people may have a gene that makes them more vulnerable to asbestos fibers. Mutations in the BAP1 gene increase the risk of mesothelioma. Genetics can affect disease risk and progression. But, asbestos exposure is the main cause.
What can I expect in the final stages of mesothelioma?
In advanced mesothelioma, patients face more pain, breathing issues and extreme fatigue. Palliative care is vital for symptom management and comfort. This includes breathing treatments, pain relief and emotional support. As the disease worsens, loved ones may see a big drop in energy, movement and awareness.
What are some end-of-life decisions mesothelioma patients and loved ones may need to make?
End-of-life decisions focus on comfort and quality of life. They involve choosing palliative or hospice care and managing pain. Patients may also opt for “do not resuscitate” (DNR) orders and consider wills. Seeking support is crucial for coping with mesothelioma’s final stages.
Recommended Reading
Your web browser is no longer supported by Microsoft. Update your browser for more security, speed and compatibility.
If you are looking for mesothelioma support, please contact our Patient Advocates at (855) 404-4592
Fact Checked
Our fact-checking process begins with a thorough review of all sources to ensure they are high quality. Then we cross-check the facts with original medical or scientific reports published by those sources, or we validate the facts with reputable news organizations, medical and scientific experts and other health experts. Each page includes all sources for full transparency.
Reviewed
Asbestos.com is the nation’s most trusted mesothelioma resource
The Mesothelioma Center at Asbestos.com has provided patients and their loved ones the most updated and reliable information on mesothelioma and asbestos exposure since 2006.
Our team of Patient Advocates includes a medical doctor, a registered nurse, health services administrators, veterans, VA-accredited Claims Agents, an oncology patient navigator and hospice care expert. Their combined expertise means we help any mesothelioma patient or loved one through every step of their cancer journey.
More than 30 contributors, including mesothelioma doctors, survivors, health care professionals and other experts, have peer-reviewed our website and written unique research-driven articles to ensure you get the highest-quality medical and health information.
About The Mesothelioma Center at Asbestos.com
Assisting mesothelioma patients and their loved ones since 2006.
Helps more than 50% of mesothelioma patients diagnosed annually in the U.S.
A+ rating from the Better Business Bureau.
5-star reviewed mesothelioma and support organization.
My family has only the highest compliment for the assistance and support that we received from The Mesothelioma Center. This is a staff of compassionate and knowledgeable individuals who respect what your family is experiencing and who go the extra mile to make an unfortunate diagnosis less stressful. Information and assistance were provided by The Mesothelioma Center at no cost to our family.
Asbestos.com. (2026, June 25). Mesothelioma Death Rate. Retrieved July 23, 2026, from https://www.asbestos.com/mesothelioma/death-rate/
MLA
"Mesothelioma Death Rate." Asbestos.com, 25 Jun 2026, https://www.asbestos.com/mesothelioma/death-rate/.
Chicago
Asbestos.com. "Mesothelioma Death Rate." Last modified June 25, 2026. https://www.asbestos.com/mesothelioma/death-rate/.
The Patient Advocates are absolutely amazing and helpful! I am so very pleased with the information and the emotional support that I have received from everyone! When I felt all hope was lost, Amy gave me great information and was so compassionate. I do not feel alone, and I know there is strong support for anyone dealing with this tragic disease. I received a FREE information package, including a recipe book, information on the disease, a toll-free number to contact for assistance, and a book with the answers to 100 questions that are commonly asked. This information alone was worth my time! I read for hours and hours, and just that alone—knowledge—can be a great comfort. To fully understand this disease, to just have the knowledge!!! Thank you all!! Thank you so, so much.
I found out about The Mesothelioma Center while researching peritoneal mesothelioma days after being diagnosed with the malignant cancer. While a lot of the 'Mesothelioma' websites are actually law firms just trying to get your business, theirs is a user-friendly, comprehensive website set up to aid patients, their loved ones, and/or caregivers with all things related to a cancer diagnosis from asbestos exposure. I was soon put in touch with one of their doctors, Snehal Smart, M.D., who immediately sent me a packet of general information, a book on surviving mesothelioma, and offered me assistance in finding doctors, reputable law firms, financial help, support groups, and so much more! The Mesothelioma Center's website is, in my opinion, the best resource for anyone suffering from cancer due to asbestos. Dr. Smart is amazing! She is very knowledgeable and helpful, but she is also a very kind, caring doctor who goes the distance whether she is researching a pertinent topic, making suggestions, providing contacts, or just being a good listener on the other end of the phone. In addition, Dr. Smart referred me to a law firm who is now fighting to get me compensation for the negligence of those defendants whose products exposed me to asbestos and caused my subsequent cancer. Thank you, TMC and Dr. Smart, for helping me determine the best treatment plan for my cancer and being part of my miracle. I am currently cancer-free and back to being a mom to my precious daughter. The Mesothelioma Center, their website, and their staff rock!!
I reached out and talked to Aaron a couple of weeks before my diagnosis of malignant mesothelioma. He was very helpful and gave me a lot of information at that time. I have talked to him several times since and always gotten my questions answered. Aaron is very knowledgeable and has been very helpful and supportive. He also sent me a comprehensive packet of information, including info on nutrition, legal help, and medical resources.
My brother was recently diagnosed with mesothelioma. I began researching it online. The information I received from The Mesothelioma Center is all-inclusive. No need to look anywhere else! The first phone call was with Karen, and she answered all my questions with ease. She also had a calming effect by presenting all the options available for my brother and his family. Thank you!
My Dad was diagnosed with mesothelioma, and thankfully The Mesothelioma Center was the first place I called. Snehal Smart answered the phone immediately and was very helpful. She immediately sent us an information packet and answered questions. She followed up each week to see how things were going and if we had any questions. She also connected us with a lawyer. I highly recommend this Center.
Dr. Jacques Fontaine is a thoracic surgeon at Moffitt Cancer Center in Tampa, Florida, where he heads up the Mesothelioma Research and Treatment Center. He specializes in minimally invasive robotic surgery and aggressive surgeries for mesothelioma.
Fact-checked and verified content:
Our fact-checking process begins with a thorough review of all sources to ensure they are high quality. Then we cross-check the facts with original medical or scientific reports published by those sources, or we validate the facts with reputable news organizations, medical and scientific experts and other health experts. Each page includes all sources for full transparency.
Please read our editorial guidelines to learn more about our content creation and review process.